East Bay Real Estate Market Trends & Conditions

by Glen Bell
As a homeowner or real estate investor, you have probably been following the recent news reports on a cooling, or a the possibility of a bubble bursting in our real estate market?
The headlines catch our attention. It’s there, in our face, almost daily, someone’s interpretation, based on some numbers, telling us of what’s really going on in our real estate markets.
One such example is a Contra Costa Times article entitled “Real Estate Market Continues to Cool,” by James Temple, based on just released statistics off of the DataQuick Information Systems site. For those who are not familiar with DataQuick, it’s one of the most up to date and more reliable research sites on real estate.
Whose crystal ball do we use? Sellers market, buyers market, normal market, housing bubble, soft landing? The information on these articles is almost always based on someone’s interpretation of old data. "Timing is everything when buying a home," is another recent article to take a look at, also written by James Temple of the Contra Costa Times.
In his article, he asks the question "Is now the time to buy an East Bay home?"
"Some industry observers answer with a resounding yes or no, having deciphered clear signs from their crystal balls that housing prices will absolutely rise -- or unquestionably fall -- over the next few years. Others, however, say that timing the market is a fool's game, that personal circumstances should outweigh short-term trends and that buyers should take precautions for any eventuality."
Often times we are listening to an analysis of a market that’s anywhere from 20 to 45 days old. Furthermore, the numbers used are very general and always cover very broad areas, with the smallest statistics being based on entire cities. What most of us really want to ask, is, “what’s happening today, in our own unique neighborhoods?”
We, as real estate agents, have access to the MLS, and are able to extract up to the minute information to give us a better clue as to what’s really happening in your neighborhoods.
However, these bits of information that we are able to pull are only snapshots. Tracking these numbers over time gives us the ability to spot trends. These trends may be subject to our interpretation, but they do give us an up to date insight on a market so that we are able to make a more well informed real estate decision.
How many homes are for sale in your neighborhood, how long have they been on the market, and how many buyers are looking? (Simply put supply and demand). This translates to actives, average days on the market (actives only), and pending sales. The relationship that we find to each other in our respective markets can give us some indication as to whether we are in a sellers, a normal, or even a buyers market. This can be done on a more local basis, being able to look at your neighborhood by itself.
The past seven years we’ve had far too many buyers’ looking at a much smaller number of homes for sale. It’s been a strong sellers market every where. As stated in the article, Ken Rosen, from UC Berkeley, is quoted as saying, “There’s no question that we have moved from a seller’s market to equilibrium or even a buyer’s market in certain cases.” I have to agree with Mr. Rosen. However, this change did not happen overnight as some other news article headlines may have suggested, but gradually over the last 6 months.
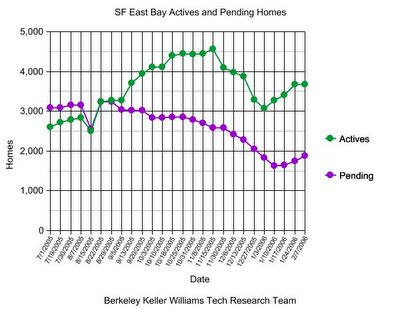
The chart above tracks the number of actives (homes for sale) and the number of pendings, (homes that are in contract with buyers). The sample was taken from 34 cities within Alameda and Contra Costa Counties. Pendings have dropped noticeably in comparison to actives since July of last year. There are more homes on the market with fewer buyers. This has been a gradual change over a six month period.
Some of what you see is seasonal, some unique to this market.
The graph above measures a very large area. A sample this large, translates to being able to make only very broad general conclusions about this market overall. It doesn’t necessarily tell the story of the market in your particular neighborhood.
In reality, there are markets within markets, different neighborhoods within cities. Not every neighborhood in Berkeley, for example, will be quite the same. Some neighborhoods will have stronger markets than others. The right house, presented well, in the right neighborhood, and at the right price continues to bring multiple offers. However, in most cases, homes are staying on the market longer, and we’re starting to see some price reductions. There are also markets within price ranges. Homes that sell for under $800,000 may have a stronger market in general than homes selling for over $1,000,000.
What can you make of all this? Making your real estate decisions should be based on up to date information that reflects the conditions of your specific neighborhood. Ask your well informed real estate agent to talk to you about the market trends and conditions of your neighborhood before making that all important decision to buy or sell a home.


<< Home